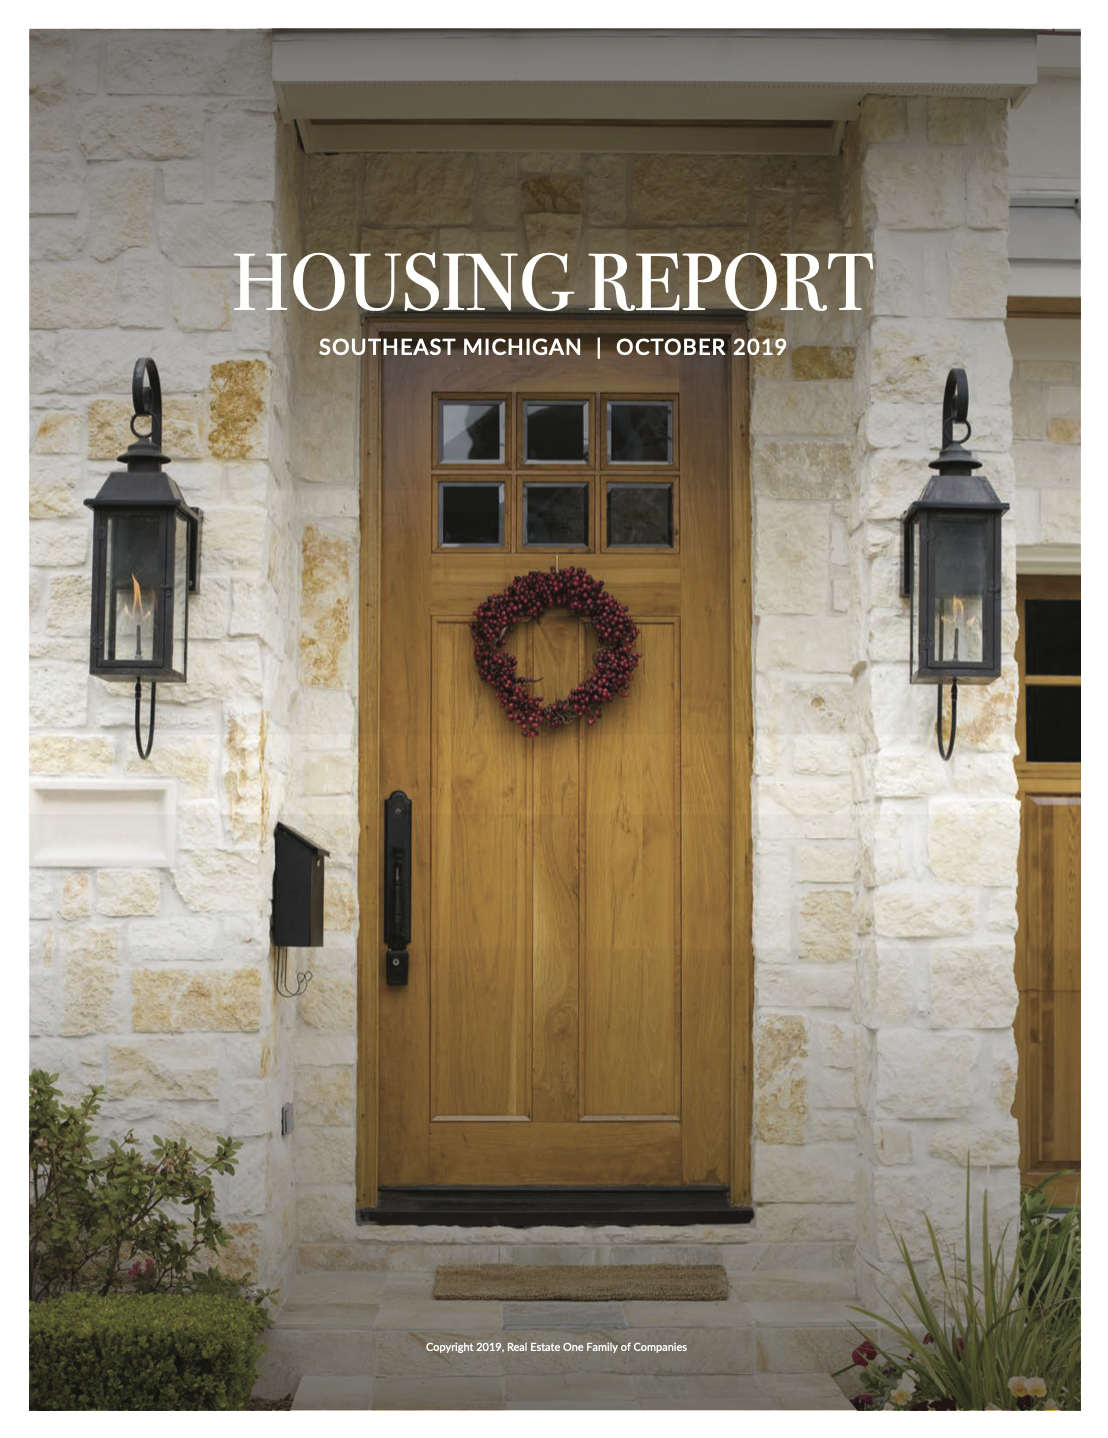
Southeast Michigan October 2019
Blog Search
Subscribe
Get the latest Michigan Housing Reports delivered straight to your inbox!

Available Listings
No change from last month

New Pendings
-15% from last month
YTD Closed Sales
No change from last year

YTD Avg Sale Price
+4% from last year
YTD Price Per Sq Ft
+4% from last year
The number of available homes remains even with last month and 5% higher than a year ago. Both September new pendings and closed sales were down 15% from the prior month. Expect sales to generally tail-off through the balance of the year as they normally do. Despite the talk all year about a slowing market, this year’s 37,315 sales have the market even with last year. In addition, YTD average sale price, price per square foot and sold volume are all up by 4%. This year’s sold volume is the highest it has ever been (5% ahead of 2017). Remain focused on currently-available opportunities.

Market Rewards Well-Prepared Listings
< 1 minute
The Southeast Michigan housing market continues to settle into a healthier, more balanced pattern. Buyer activity remains strong, with new pendings rising 3% year-to-date despite new listings trailing last year [...]
Inventory Builds as Spring Market Takes Shape
< 1 minute
The Southeast Michigan housing market is moving into spring with many of the trends from earlier in the year still in place, now forming a clearer pattern. Compared to recent [...]
Growing Inventory Despite Fewer New Listings
2 minutes
Inventory continues to rise, even as fewer new listings are coming to market. Active listings are up 21% compared to a year ago, increasing from 5,300 to 6,500. At the [...]
©2026 Max Broock. All rights reserved.