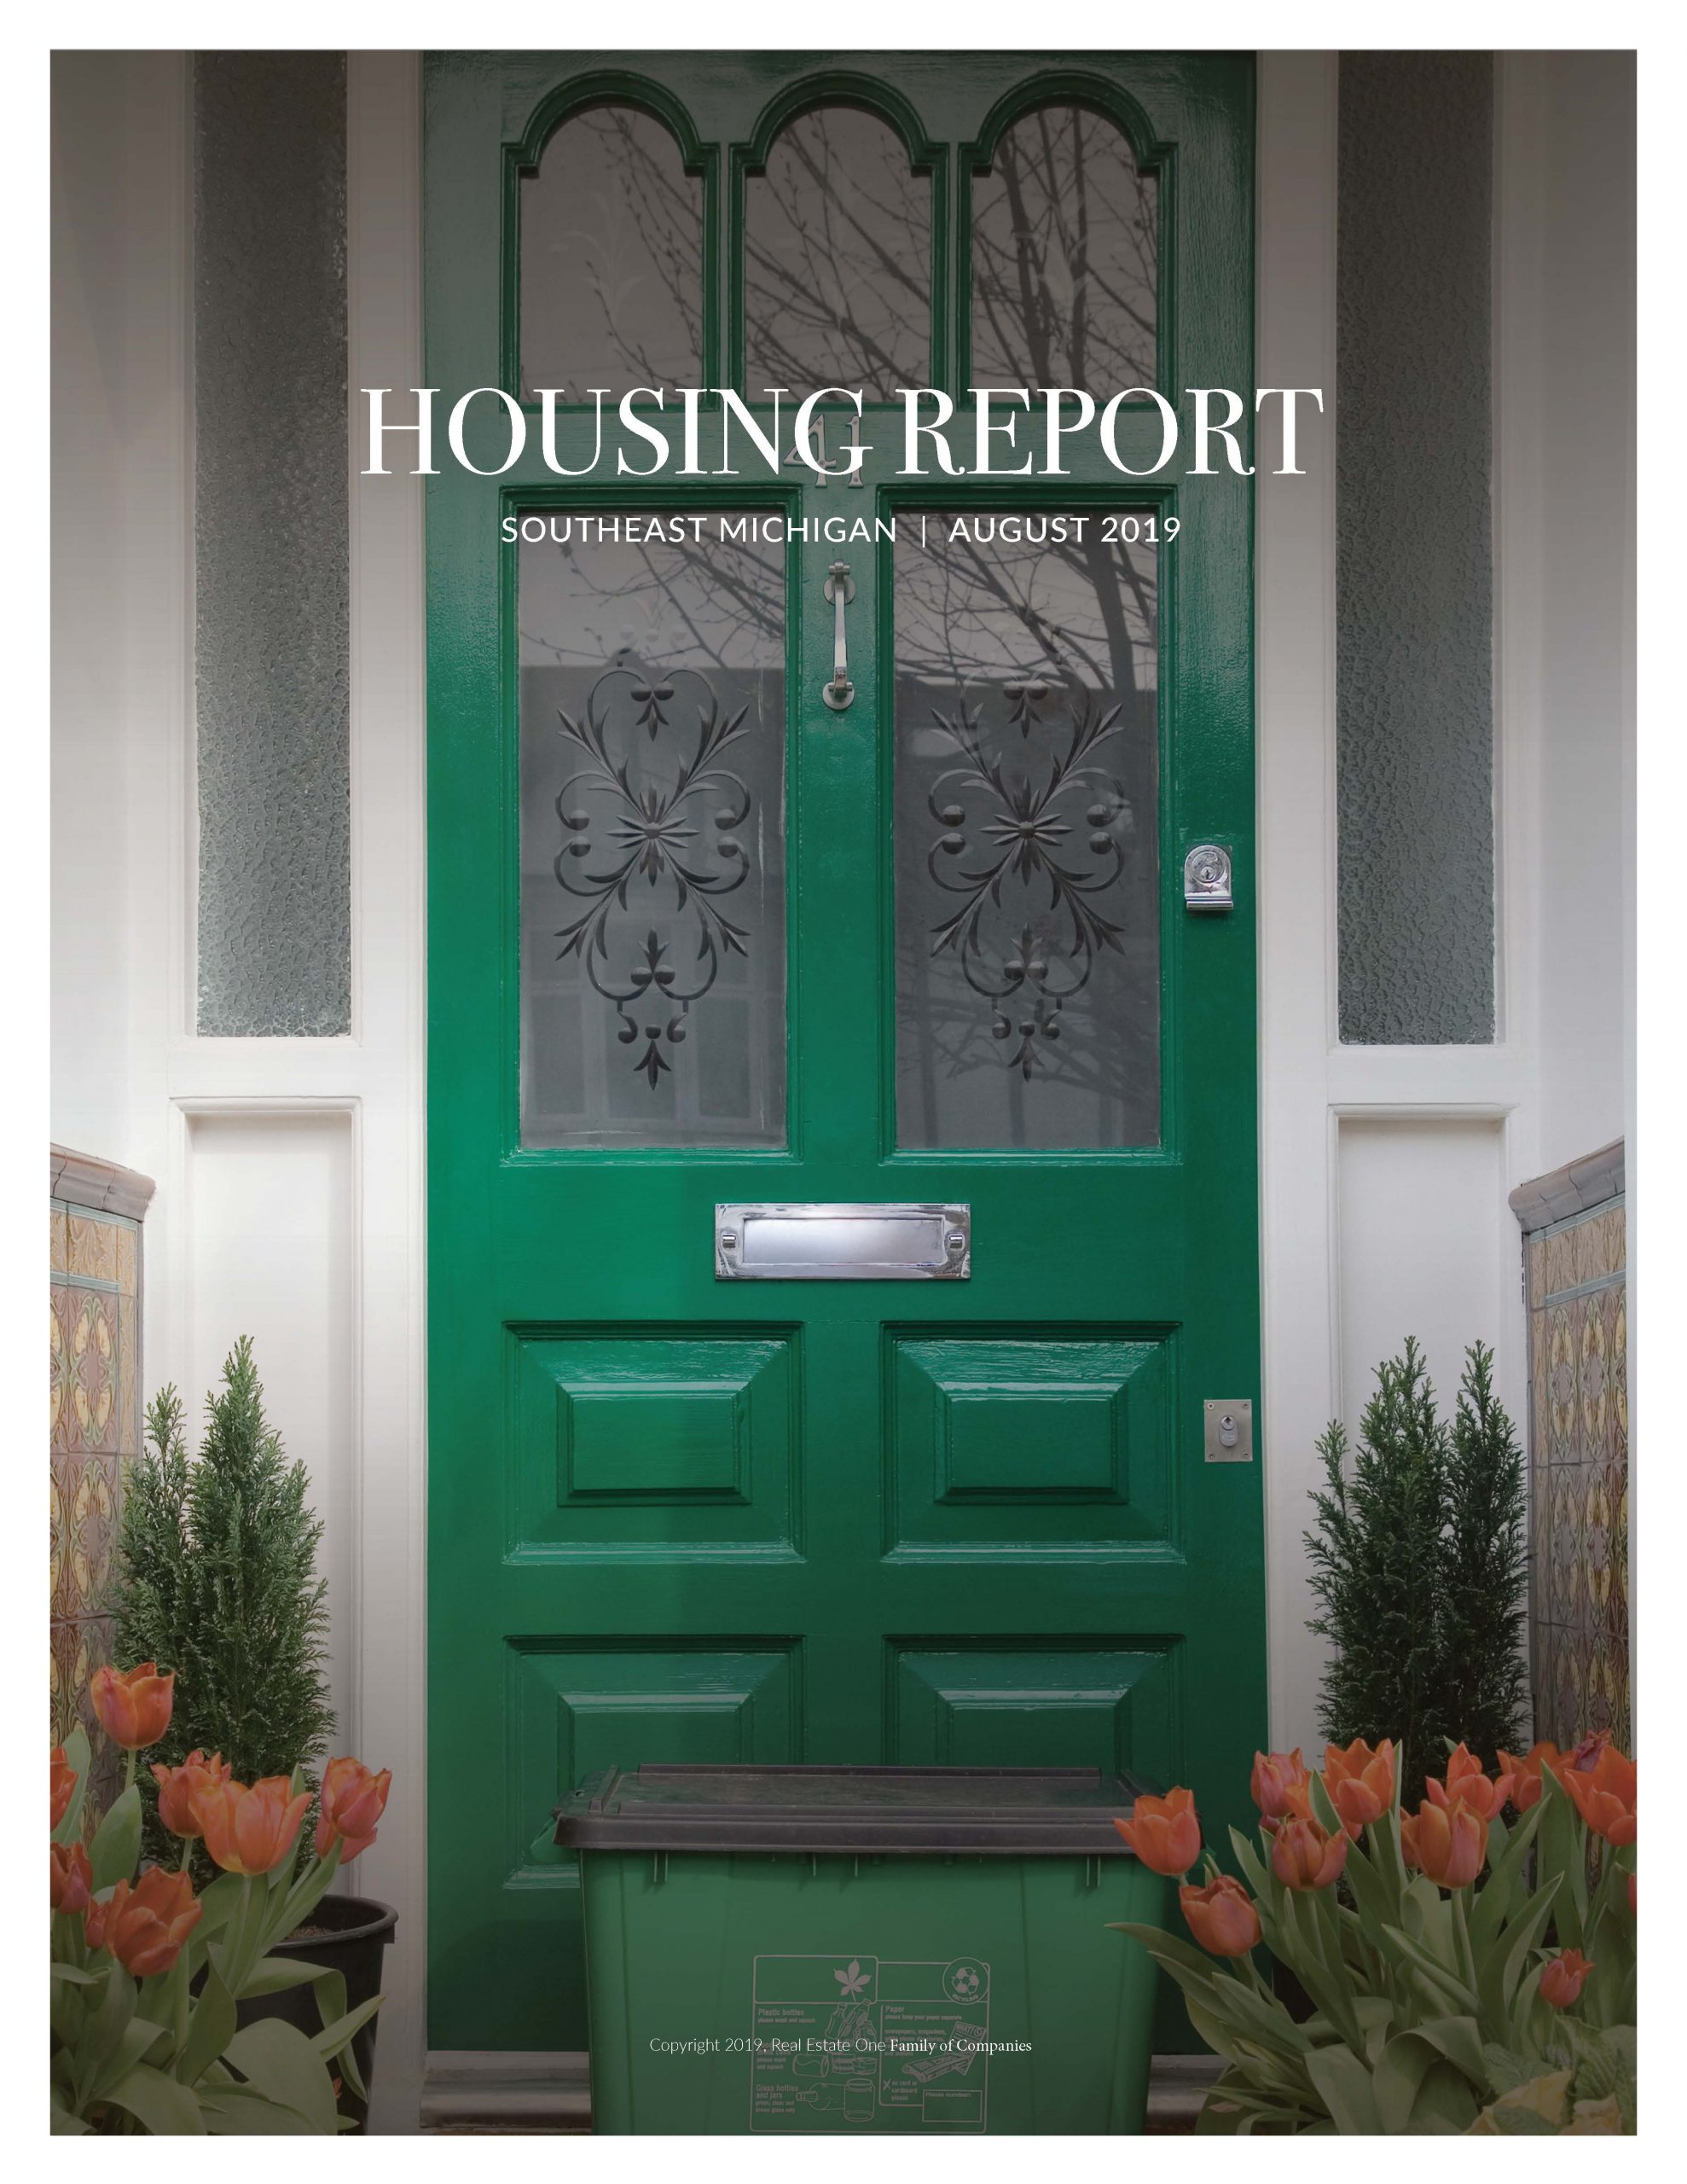
Southeast Michigan August 2019
Blog Search
Subscribe
Get the latest Michigan Housing Reports delivered straight to your inbox!
Available inventory rose 8% in the past month—it’s 13% higher than a year ago. Both July new pendings and closed sales were up 2%. YTD sales are just short of even with last year but both average price and price per square foot are up 3%. Entry-level activity continues to shrink while the middle and upper markets expand. Despite a 12% increase in listings priced under
$150k, sales in that range have dropped 6%. At the same time, there’s been a slight decrease in the availability of over-$500k listings, yet those sales are up 3%. Activity varies greatly by market area and price range.

Available Listings
+8% from last month
New Pendings
+2% from last month

YTD Closed Sales
-1% from last year
YTD Avg Sale Price
+3% from last year
YTD Price Per Sq Ft
+3% from last year

Market Rewards Well-Prepared Listings
< 1 minute
The Southeast Michigan housing market continues to settle into a healthier, more balanced pattern. Buyer activity remains strong, with new pendings rising 3% year-to-date despite new listings trailing last year [...]
Inventory Builds as Spring Market Takes Shape
< 1 minute
The Southeast Michigan housing market is moving into spring with many of the trends from earlier in the year still in place, now forming a clearer pattern. Compared to recent [...]
Growing Inventory Despite Fewer New Listings
2 minutes
Inventory continues to rise, even as fewer new listings are coming to market. Active listings are up 21% compared to a year ago, increasing from 5,300 to 6,500. At the [...]
©2026 Max Broock. All rights reserved.